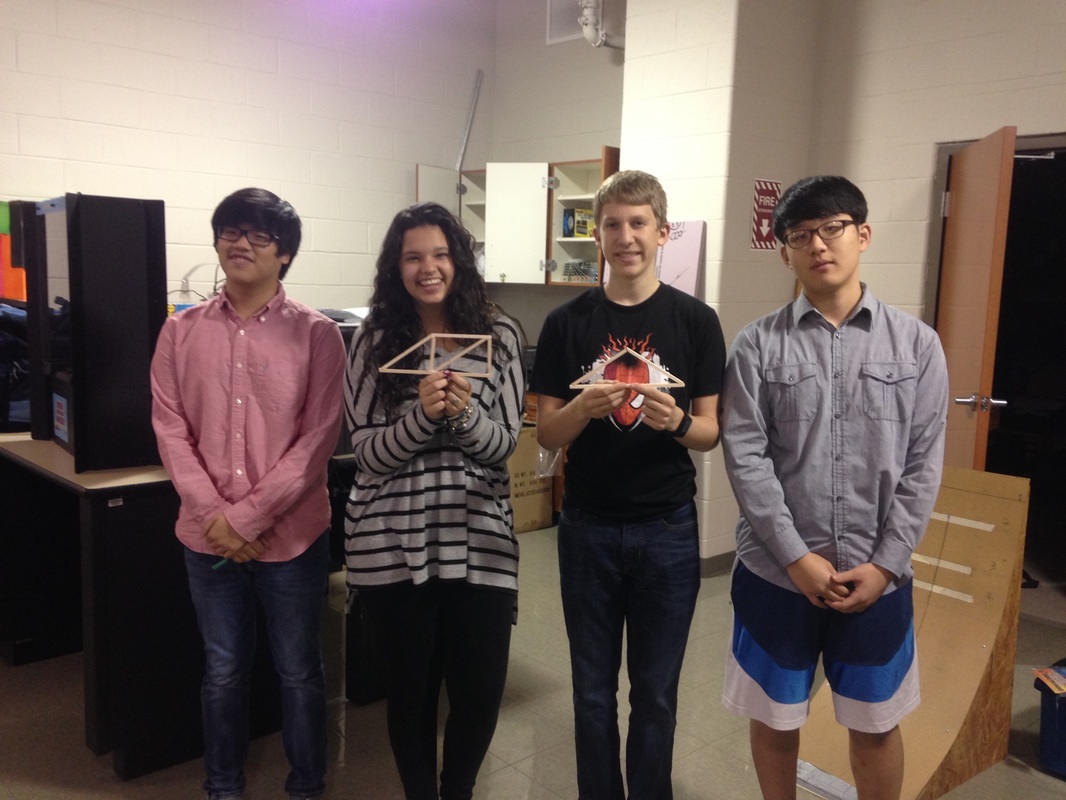
TEam picture
explanation
we made a two truss to perform the destructive tests of each. And, we recorded the test result and failure point locations on graph paper.
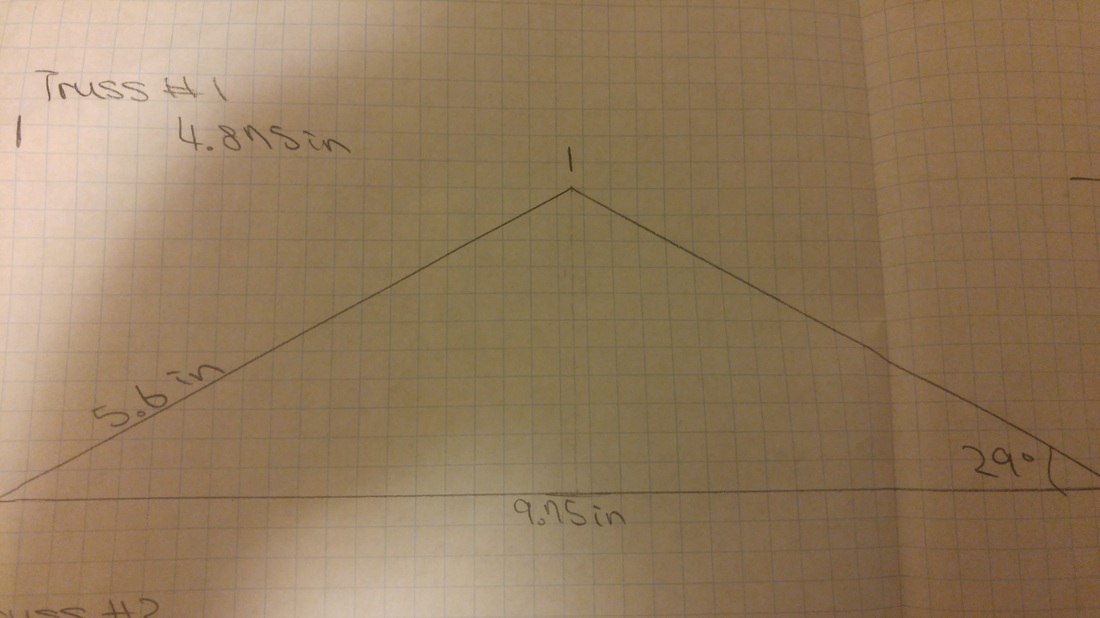
truss #!
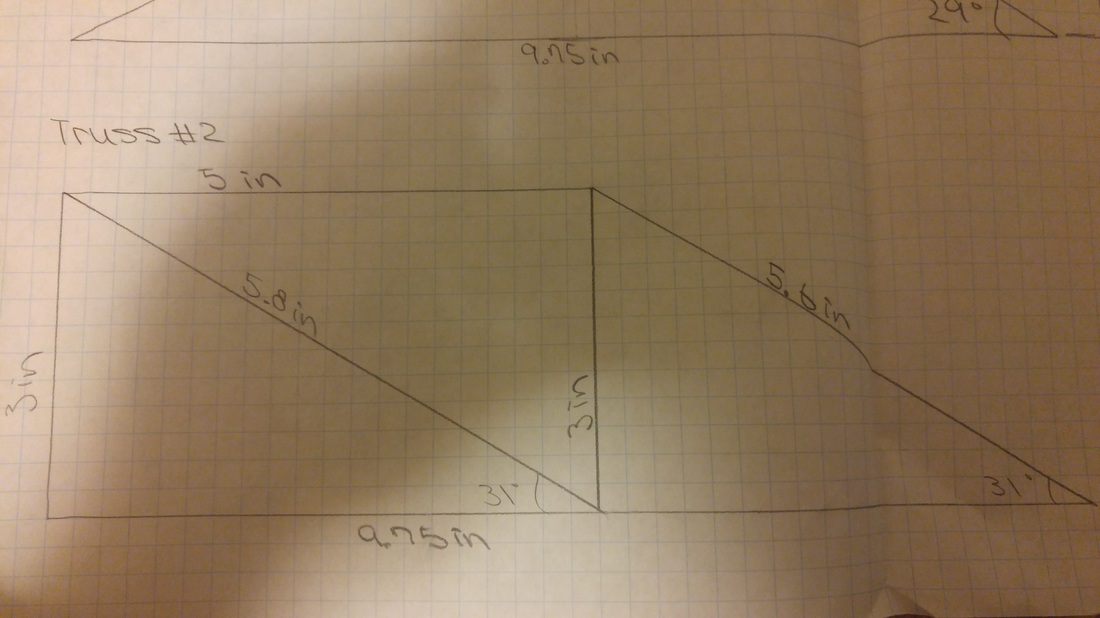
truss #2
graph
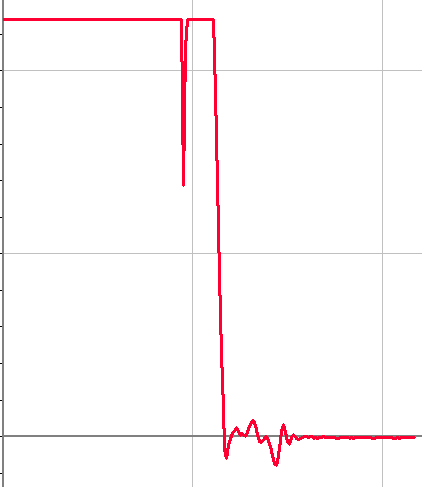
testing
EFFICIENCY evaluation
Truss W =Weight of truss (g) W= Converted (N) F =Force applied at failure (N) Efficiency calculation (F / W) x100
Model 1 2.5g 0.024516625 11.73 .209%
Model 2 4.4g 0.04314926 21.23 .203%
Model 1 2.5g 0.024516625 11.73 .209%
Model 2 4.4g 0.04314926 21.23 .203%
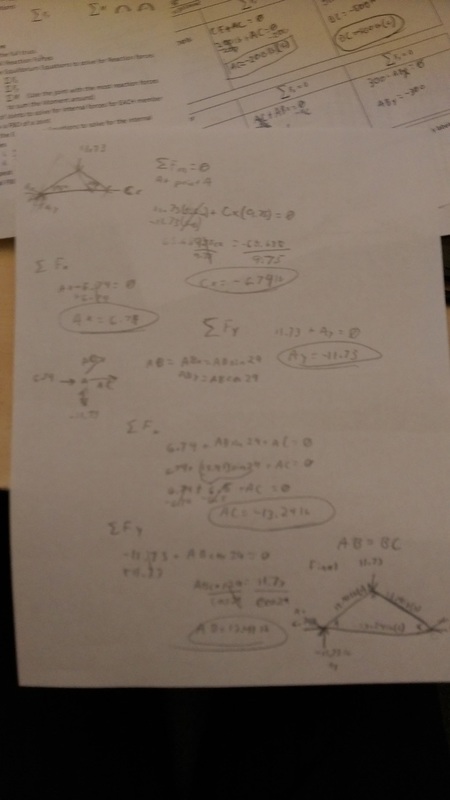
truss calculation #1
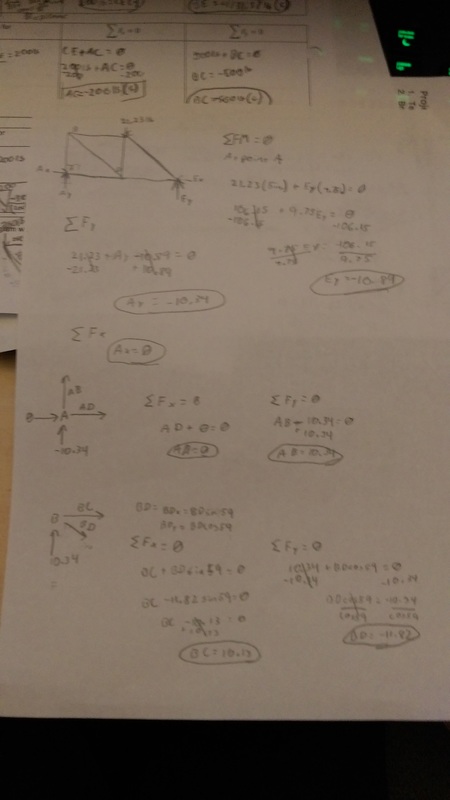
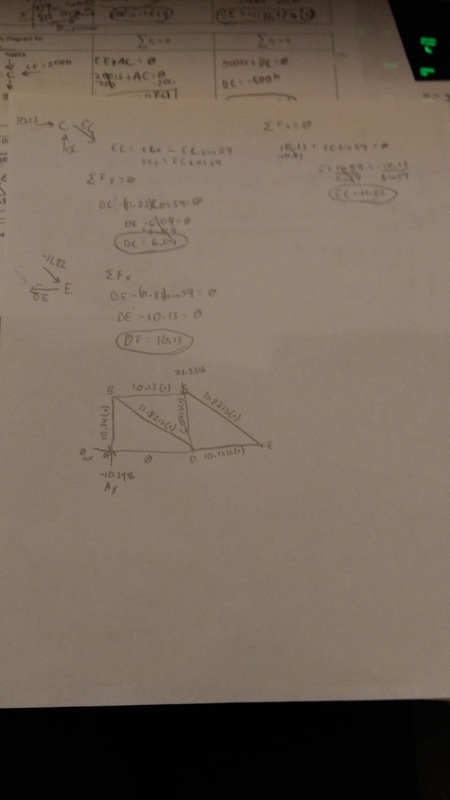
TRUSS CALCULATION #2
conclusion
a. Explain why you think failure occurred at the truss member where it did. Did your truss fail at the member that your calculations revealed as undergoing the most stress? The failure occurred, because it was weakest point obviously and there wasn't a support to hold the weight.
b. If given a chance to redesign your truss after testing, what changes would you make? If given a chance to redesign your truss after testing, what changes would you make?I would adds the few support to stabilizes the truss for more weight force.
b. If given a chance to redesign your truss after testing, what changes would you make? If given a chance to redesign your truss after testing, what changes would you make?I would adds the few support to stabilizes the truss for more weight force.
